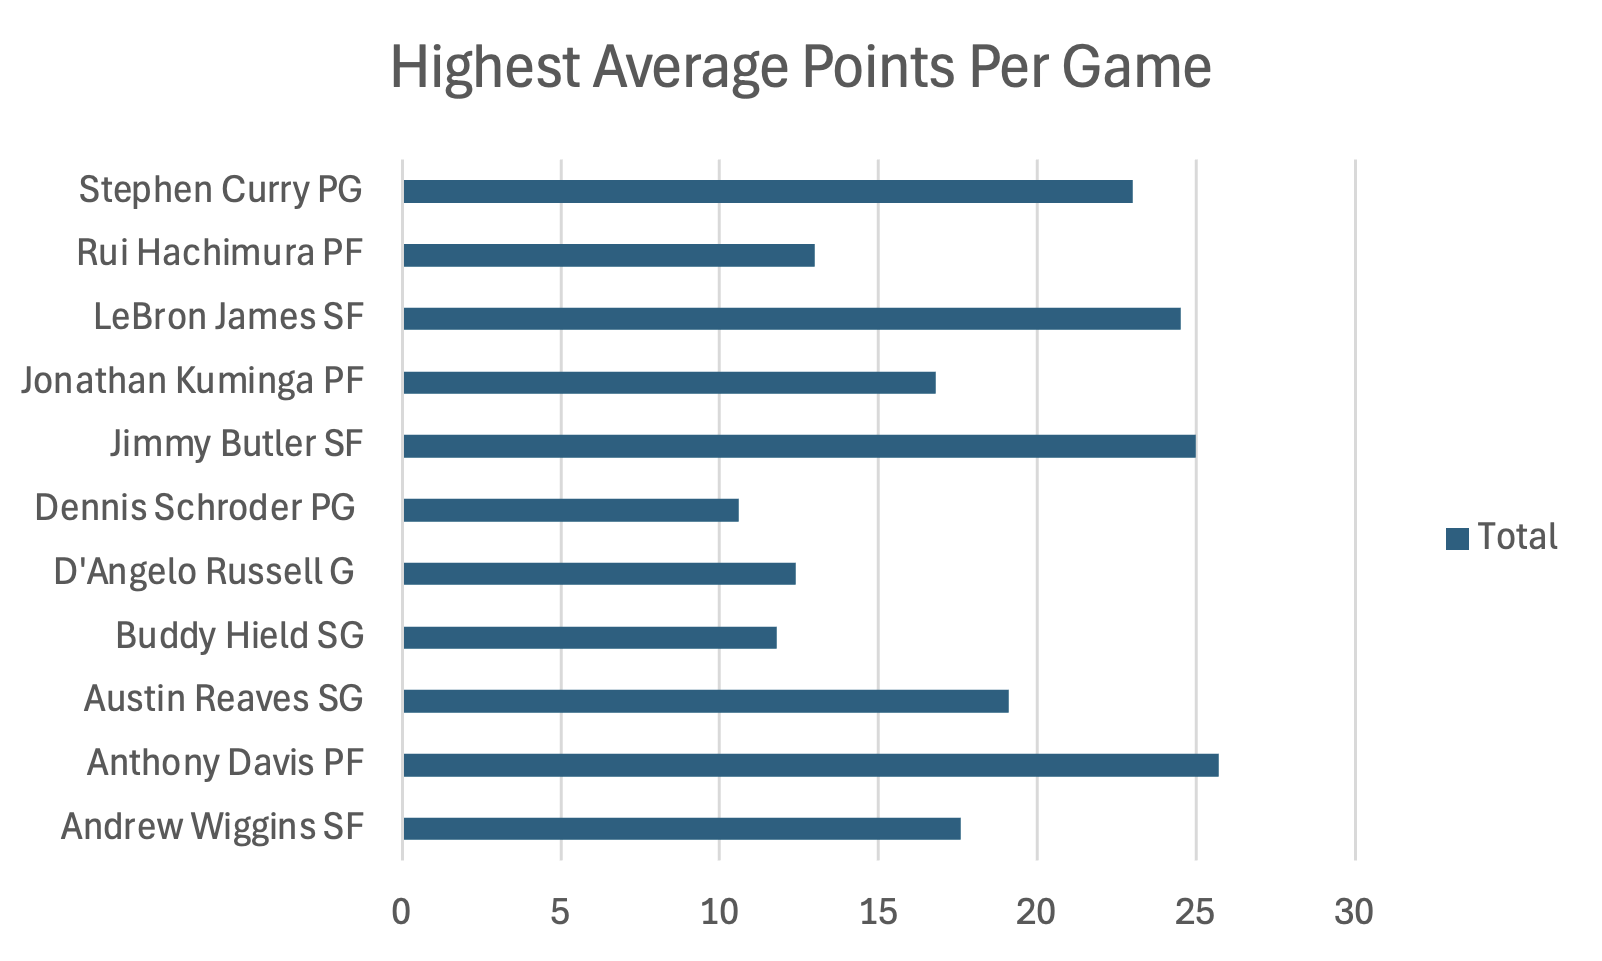
Pivot Charts and Data Insights from the NBA Basketball Dataset
| Name | Team | GP | GS | MIN | PTS | OR | DR | REB | AST | STL | BLK | TO | PF | AST/TO |
|---|---|---|---|---|---|---|---|---|---|---|---|---|---|---|
| Anthony Davis PF | Los Angeles Lakers | 42 | 42 | 34.3 | 25.7 | 2.8 | 9 | 11.9 | 3.4 | 1.3 | 2.1 | 2.2 | 2 | 1.5 |
| Jimmy Butler SF | Golden State Warriors | 1 | 1 | 29 | 25 | 1 | 1 | 2 | 4 | 1 | 1 | 1 | 1 | 4 |
| LeBron James SF | Los Angeles Lakers | 46 | 46 | 34.7 | 24.5 | 0.9 | 6.9 | 7.8 | 9 | 0.9 | 0.5 | 3.8 | 1.4 | 2.4 |
| Stephen Curry PG | Golden State Warriors | 43 | 43 | 32 | 23 | 0.6 | 3.9 | 4.5 | 6.1 | 1 | 0.5 | 3 | 1.3 | 2.1 |
| Austin Reaves SG | Los Angeles Lakers | 45 | 45 | 34.8 | 19.1 | 0.8 | 3.5 | 4.3 | 6.1 | 1.2 | 0.2 | 2.5 | 2 | 2.5 |
| Andrew Wiggins SF | Golden State Warriors | 43 | 43 | 30.1 | 17.6 | 1.5 | 3 | 4.6 | 2.4 | 0.9 | 0.8 | 1.3 | 1.6 | 1.8 |
| Jonathan Kuminga PF | Golden State Warriors | 32 | 10 | 26 | 16.8 | 1.4 | 3.6 | 5 | 2.2 | 0.9 | 0.6 | 1.6 | 1.9 | 1.4 |
| Rui Hachimura PF | Los Angeles Lakers | 43 | 43 | 32.1 | 13 | 1.5 | 3.7 | 5.2 | 1.5 | 0.8 | 0.5 | 0.9 | 1.9 | 1.6 |
| D'Angelo Russell G | Los Angeles Lakers | 29 | 10 | 26.3 | 12.4 | 0.3 | 2.5 | 2.8 | 4.7 | 0.8 | 0.1 | 1.7 | 1.8 | 2.7 |
| Buddy Hield SG | Golden State Warriors | 52 | 20 | 23.5 | 11.8 | 0.6 | 2.7 | 3.3 | 1.7 | 0.9 | 0.3 | 1.2 | 1.8 | 1.4 |
| Dennis Schroder PG | Golden State Warriors | 24 | 18 | 26.2 | 10.6 | 0.4 | 1.9 | 2.3 | 4.4 | 1 | 0.1 | 2 | 2.8 | 2.2 |
This bar chart illustrates the average points per game (PTS) for each player. Top scorers, such as Anthony Davis and LeBron James, are clearly visible, while players with fewer points stand out as lower bars. It quickly highlights the scoring hierarchy within the dataset.
This pie chart compares the average rebounds per game for the Los Angeles Lakers and the Golden State Warriors. It reveals which team secures more rebounds on average, providing insight into each team’s dominance in rebounding.
This chart shows each player's assist-to-turnover ratio (AST/TO), a key measure of efficiency and ball handling. Higher ratios indicate better decision-making and fewer mistakes. Players like LeBron James may stand out with a higher AST/TO, showcasing strong playmaking ability.